This file was automatically generated: 2012-05-03 04:13
A example of tuning of a slightly detuned loop antenna with aid of AnTune software.
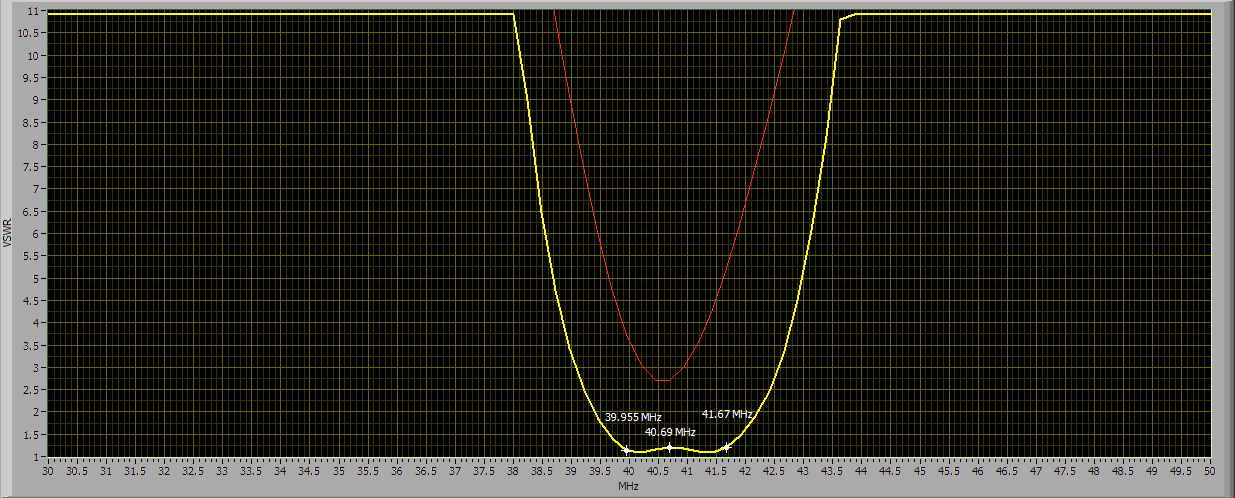
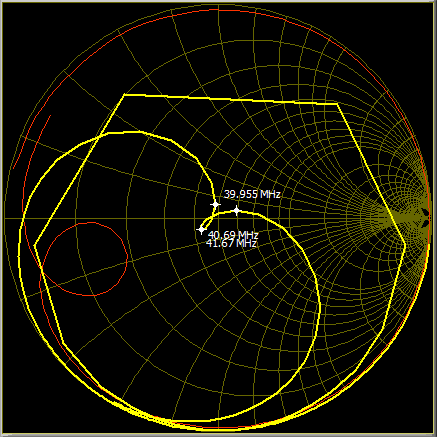
Red curve before tuning and yellow curve result after tuning.
How this was done in steps:
Imported a measured S11 Touchstone file.
Set frequency marker for the whished bandwidth.
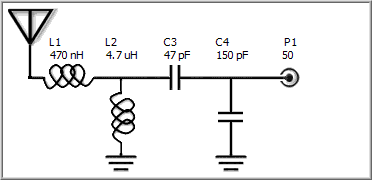
If required, limit network configuration to fit an existing layout or let AnTune select best alternative.
AnTune will automatically calculate all values within seconds.
Proposed matching network circuit and resulting impedance curves are automatic generated.
Results can be saved as html such as this file, or as a Touchstone file.
The software has no complicated menus or settings.
From start of the software until this finished result takes less than a minute.
With a matching network can reflection loss be reduced and usable bandwidth can be increased
which makes the antenna more immune against surrounding changes or a RF circuit more
effective and stable over a wider frequency range.
This example is based on a imported Touchstone file, but the software can also get data
directly from a Vector Network Analyzer (GPIB) and present a optimized network about
10 times per second or better, depending how fast the instrument is.
Getting data in real time together with a optimized matching network, is invaluable
when developing antennas, as the antenna shape that result in a very wide bandwidth together with a
for the moment unknown configuration of a L/C network else not is possible to predict.
Here is the unmodified S11 file if you want to verify in an alternative software that the showed matching network gives actual results.